Confounding or the relationship between shoe size and salary
06 Dec 2016There are few terms in the context of statistics which I find very interesting and powerful when I, first, understand it. One of which is, undoubtedly, the concept of confounding. This term attracted my attention; since, in my opinion, it has potential to explain many mechanisms in different fields when statistical methods are used as tools. As you may imagine, medicine, biology or political science are only some examples for different areas. To explain the confounding, I use following example.
A simple example
Now, assume that we want to examine the association between the salary per month of a person who lives in Zurich city and his or her shoe size. Of course, you may think this example is a silly one, but, I believe, by using such an example, one can understand the confounder term very easily. In order to have some data to analyse, you go to city’s most crowded street and collect data by using a questionnaire. Assume that your questionnaire is valid, you asked 1000 people (enough sample size!), so in short your data is reliable. Then you want to plot your data so as to see what is going on in the dataset. So, you decided to use a scatterplot, and you get below figure.
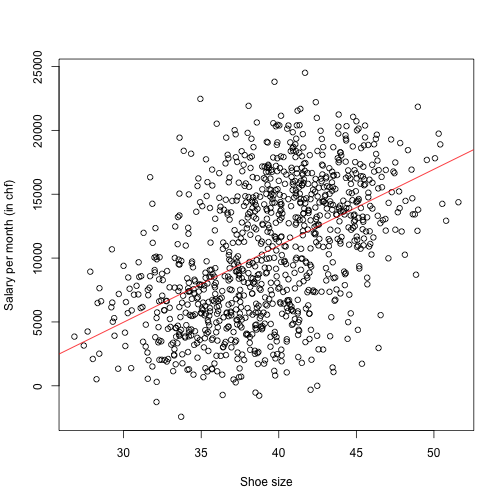
Moreover, you use simple regression, estimated the regression line and plot it as a superimposed line to the Figure (Of course I did not do any survey, I just simulated data).
Then, you concluded from this Figure as follows:
There is a strong association between shoe size and salary per month. With increasing shoe size of a person, his or her salary is increasing.
So far, everything seems you correct but still we have a weird conclusion, right? You can understand the underlying problem, when you plot the same data but now using different colors for male and female (luckily you have gender information coming from your questionnaire). And you plot two simple regression lines for female and male separately – you estimated those two lines by using two different subset of data. So we obtained the below Figure.
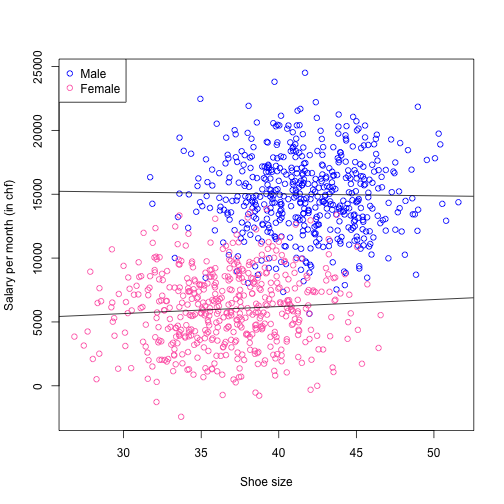
Now our conclusion is changed completely! The effect vanished, and now we don’t have any evidence suggest that there is an association between shoe size and salary. Our possible conclusion, however, is as follows. Males have substantially larger shoe size than females on average (which has a biological explanation) and also, males has earning more money on average (which is also true indeed). But shoe size has nothing to do with salary for both subset of data! In such a case, gender is a confounding variable which is mixing the effect. In this scenario, we see an effect which is not there, actually. But in other situations, you can see an effect but you may get the direction wrong.
These situations are not an extreme cases, especially if you are working with observational data. Therefore, one should try to eliminate any possible confounders. For example, if you are investigating a health-related issue, age and gender are usual suspects. But at the end of the day, it is very important not to overinterpret the results in case of any confounders.